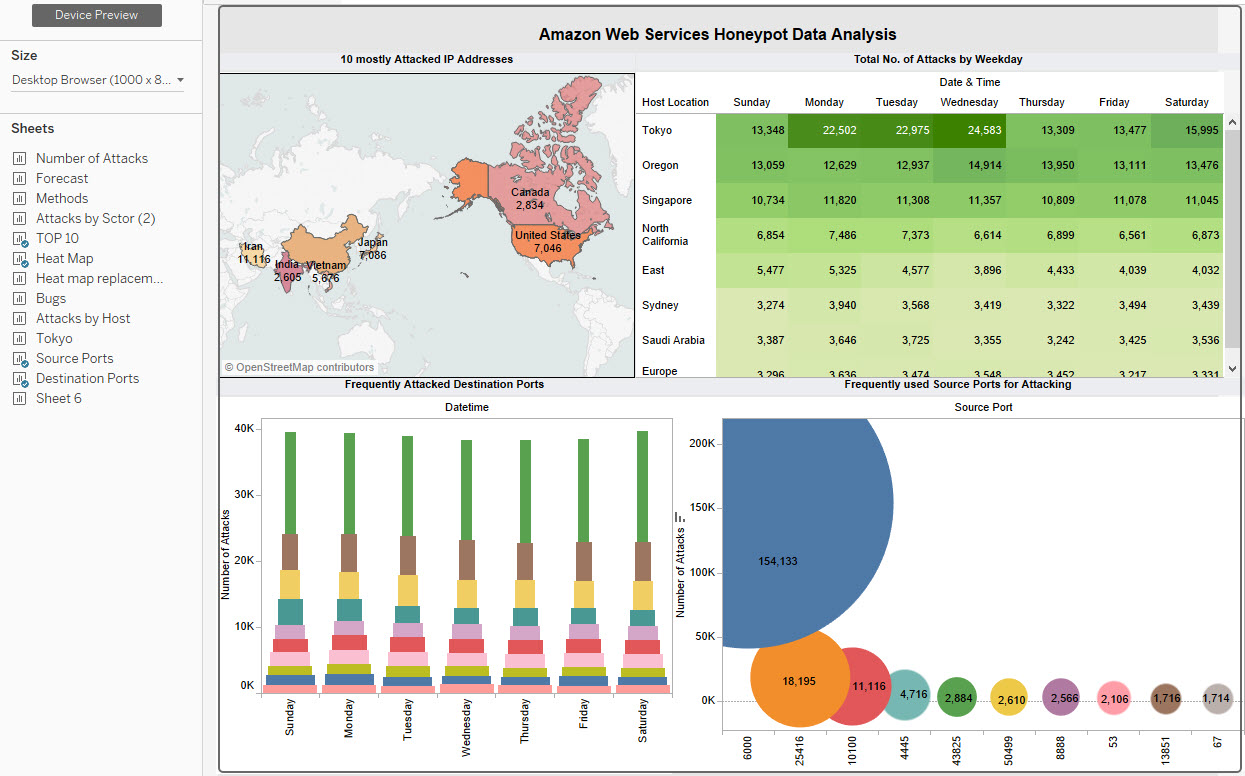
Cybersecurity has played an important role in recent years . As experts predict, the number and seriousness of cyberattacks are expected to increase through the following years . This project is conducted to gain better insight on cybersecurity and its’ threats as such SQL Injection. Our project objective is to explore how effective “honeypot” is, as a security mechanism. Honeypot is used to secure computer systems from threats, attacks and prevent unauthorized user logins. Our curiosity comes from how it functions and its effects on cybersecurity.
The dataset includes 451,582 data points from 3rd March 2013 to 8th September 2013 that will be used to find out where the potential threats are coming from. Next, we will break down the data to discover more details regarding the data set on nationalities and patterns of threats. Our research questions are related to identifying top threats based on IP addresses, frequency of attacks, mostly attacked destination ports, mostly used protocols and ports to perform the attack.
The results will help determine the countries on highest attacks and predictions could be made to minimize the attacks in the future utilizing visual analytics. Some basic visualizations will include a timeline analysis, a geographical analysis, dashboard and storytelling to discover hidden patterns to help the audience understand the proposed questions. Based on our initial findings, highest number of attacks are made on Monday- Wednesday as compared to Thursday – Sunday.
Key words
Data visualization, Honeypot, Cyber Security

